Market Notes
Bitcoin's Next Leg Needs 5.28% Yields to Fall, 2026

The Take
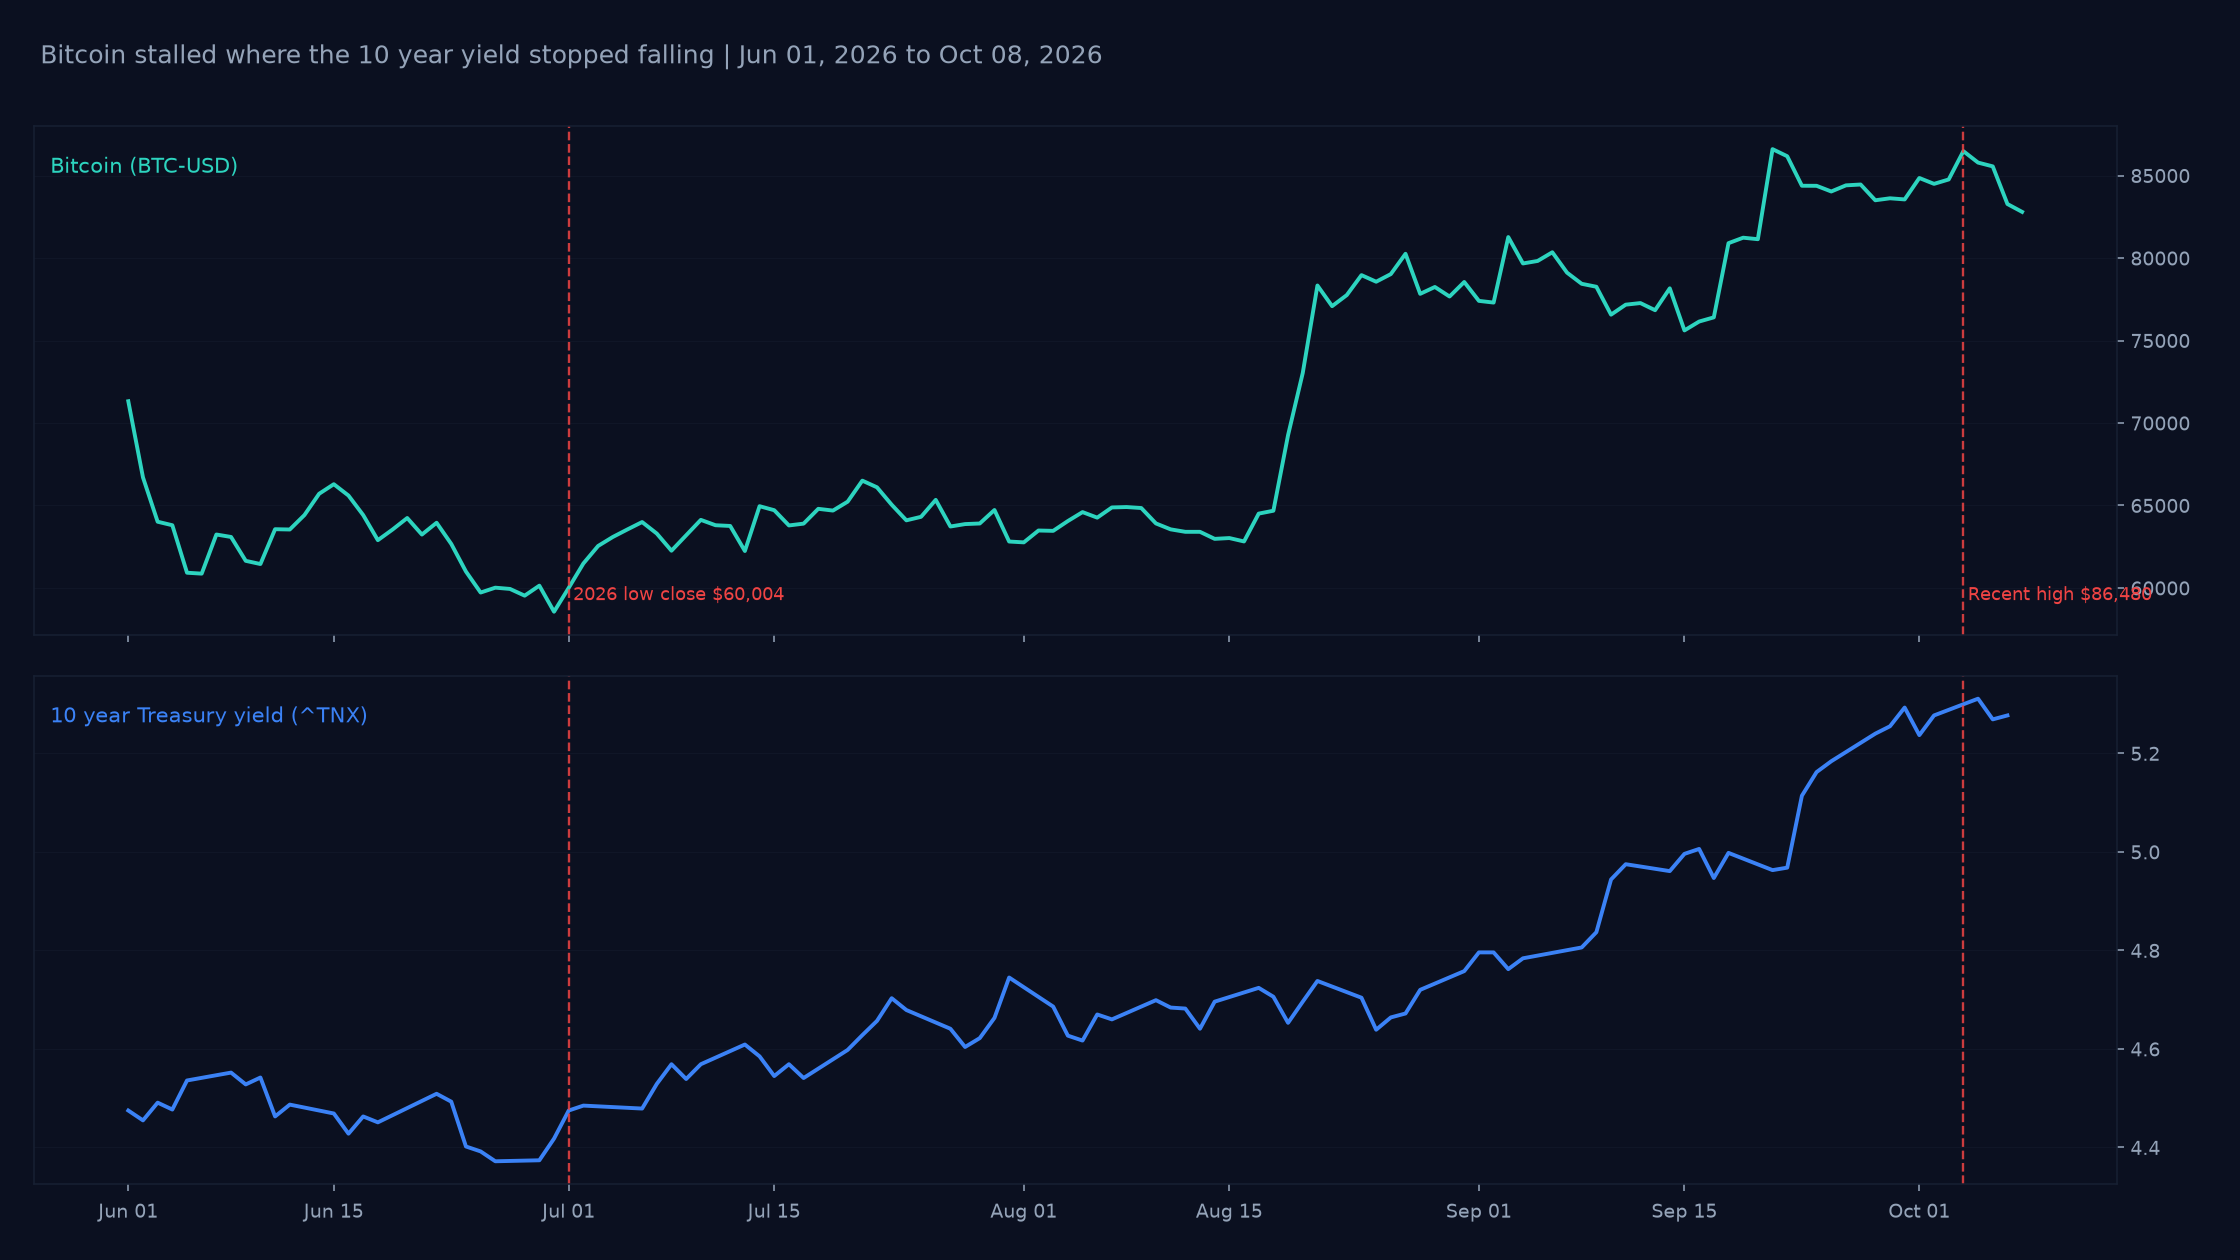
Bitcoin is $82,851 this morning, 34% below the record it set on October 6, 2025, and still 38% above its lowest weekly close of the year, back on July 1. The bull case everyone's talking about needs it back over $100,000, and it hasn't closed a single week above that number in 2026. What's in the way isn't the chart, it's 2 macro numbers: the 10 year Treasury at 5.28% and Brent crude back over $104. Both of those moved the wrong way in the last 4 days, and Bitcoin dropped 4.2% while the S&P and the Nasdaq barely moved. So I'm watching those 2 numbers, not the Bitcoin chart.
What the Data Shows
Start with what Bitcoin actually did. It closed at $86,480 on October 4 and was $82,851 at 9:02 a.m. UTC on October 8, which is 4.2% off in 4 days, per Yahoo Finance daily data for BTC-USD. Zoom out and 2026 has been a round trip: the best weekly close all year was $96,929 on January 14, the worst was $60,004 for the week ended July 1, and today's price sits 38% above that low. The record high is still $126,198 intraday on October 6, 2025, so this whole move is a bounce inside a 34% drawdown, not a new high.
Now the rates side, because that's the part people skip. Treasury's own daily par yield curve puts the 10 year at 5.24% on October 1, 5.31% on October 5, and 5.28% on October 7, so the week went up and not down. FRED has the 2 year at 4.79% on October 6 and the 10 year minus 2 year spread at 0.51% on October 7. For an asset that pays nothing and holds nothing, a risk free 5.28% for 10 years is the competition, and that competition got slightly harder this week.
The oil leg got worse in a single session. Brent futures closed at $100.20 on October 7 and were $104.28 at 8:52 a.m. UTC on October 8, up 4.1%, on reports of attacks on tankers in the Strait of Hormuz. The EIA published its Short Term Energy Outlook on October 6 with a Brent forecast of $96 a barrel for 2026 and $84 for 2027, and it assumes Middle East oil flows stay constrained through the fourth quarter. So the government's own base case has oil coming down next year, while spot is trading above the full year 2026 average it just forecast.
Why It Matters for Your Portfolio
Bitcoin keeps getting sold to people as the macro hedge and it keeps trading like the highest beta line in the book. From October 5 to October 8, S&P 500 futures were flat at 7,826.25 and Nasdaq 100 futures were down 0.21%, while Bitcoin lost 4.2% off its October 4 close, so this wasn't a broad risk off, it was Bitcoin specific. If you own it, you're long a no cash flow asset in a 5.28% world, and an oil shock feeds the inflation path that keeps yields right there. You get both working on the same position at the same time.
What I'm Watching
2 levels and 1 date. First, whether the 10 year can put in a weekly close under 5.20%, because the "yields come down" half of the bull case needs that and nothing in this week's prints points to it. Second, Brent back under $100 on a weekly close, which would tell me the Hormuz premium is deflating instead of building. The September CPI report lands October 14 at 8:30 a.m., and an oil driven print is the fastest way to shove the 10 year back toward 5.31%. If Bitcoin reclaims the $86,480 close from October 4 while both of those are still going against it, then I'm wrong that the macro is the gate here, and I'll say so.
Related Reading: The Yields-Up, Dollar-Down Signal Nobody Priced in 2026 and The Dollar's Second Life Is Being Built On Chain Now
Disclosure: I hold no position in Bitcoin. As of September 2, 2026 I do hold $MSTR, which holds Bitcoin on its balance sheet.
Howard is a full-time trader based in New Jersey with 13 years of experience across Forex, crypto, equities, and futures. He started Position Note to document his trades and analysis in public. All positions are disclosed. Nothing here is personalized investment advice.